Event Buddy Mobile App
View and search for extracurricular opportunities on campus,
and connect with others
attending the same event
View and search for extracurricular opportunities on campus,
and connect with others
attending the same event
With over 800 clubs and student-run organizations, University of Toronto provides many student opportunities for extracurricular involvement. As a result, there is an overwhelming amount of event information advertised to students.
How do you find the right events to attend and decide whether it’s worthwhile to attend?
Oct-Dec 2018
Mobile App (Android)
UX Designer
and Researcher
Sharon Lam
Victoria Ho
Jessica Yao
Competitive Analysis
Interviews
Surveys
Personas
Prioritization Grid
Figma
InVision

Discovering Problem Space
Why is extracurricular involvement important, and what is the current process like for students?
To get a comprehensive understanding of the connection between university students and extracurricular involvement, we looked into secondary resources and conducted competitive analysis on existing apps and services relating to students and extracurriculars.

Journal of Educational Psychology
Psychology in Schools
Engaging University Students
Key Takeaway #1:
Students with higher levels of peer
support demonstrated higher levels of school engagement
Key Takeaway #2:
Students reported significantly lower levels
of actual engagement than they expected when they first entered university, with the “out-of-class interaction”
category being the most disappointing.

CLN (Career Learning Network)
Libcal
The Student Life App
Email Listservs
Key Takeaway #1:
There is not one platform that consolidates all UofT events
Key Takeaway #2:
Most platforms have no search functionality to find specific events, and were difficult to navigate
How do students feel about extracurricular involvement, e.g. events, clubs?
In order to dive deeper into user needs, I recruited and conducted interviews with representative users to understand their event finding behaviour, motivations for attending events, and factors affecting event attendance. We also distributed surveys online and paper surveys randomly on campus.

Participants: UofT undergraduate and graduate students of different faculties Preparation: Created using Google Forms - digital version distributed via online networks, while paper version distributed randomly on campus
64.3% of respondents made a friend by attending the same event
92.9% of respondents want to attend university hosted events to meet new people or expand their networks

Participants: UofT undergraduate and graduate students of different faculties Preparation: Representative users were selected by pre-screening questionnaire, and ran pilot tests to check for leading questions
All participants described more positive experiences when attending events with someone they knew
“I was not ever by myself during an event...if I had someone with me, there is more reason to stay since there are more things to do [e.g. discuss with friend]” - Participant 2
Analysis of Findings
We created an affinity diagram to find common patterns and establish key themes from our research.
Our main findings relating to our users’ needs are:
1
Students are overwhelmed by the sheer amount of event information from scattered sources
2
Students feel awkward going to events alone, and are more likely to attend / stay longer if they know someone at the event
3
Students would like to be more actively involved in university events
4
Students attend events mainly to network/meet new people
Setting User Goals and Behaviour
Using our primary research, we developed a persona of our representative user, Sam, to describe her needs, behaviours, goals and pain points. We also created an as-is scenario to outline how she currently looks for university events and to identify pain points.
Turning broad concepts to UX solutions
How might we help students find events efficiently and encourage a positive event experience?
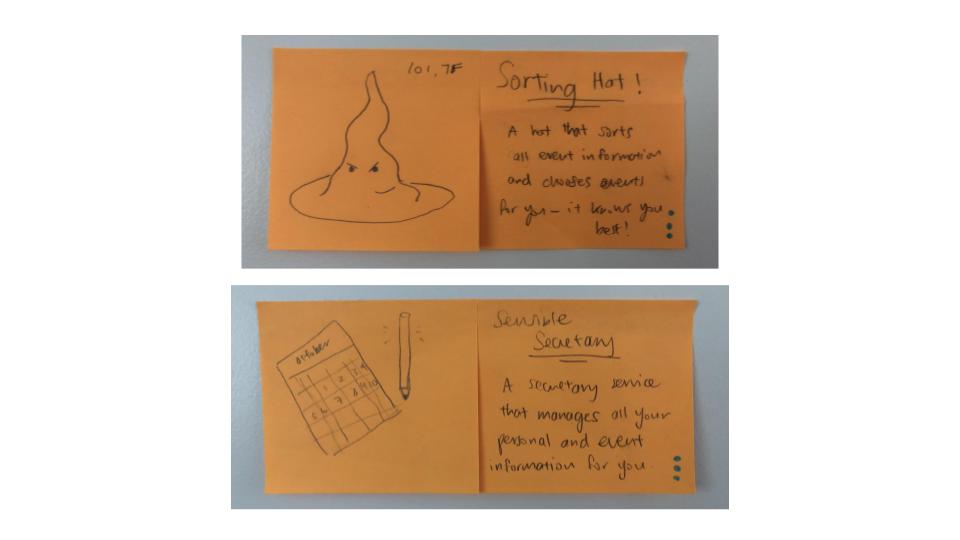
Based on our research, we believe there is a gap between what is available for students and their expectations. With sticky notes in hand, we let our creativity flow and brainstormed lots of ideas based on users' needs and pain points established. For fun, we also came up with some ideas that were a bit more absurd, i.e. a sorting hat that finds events for you!
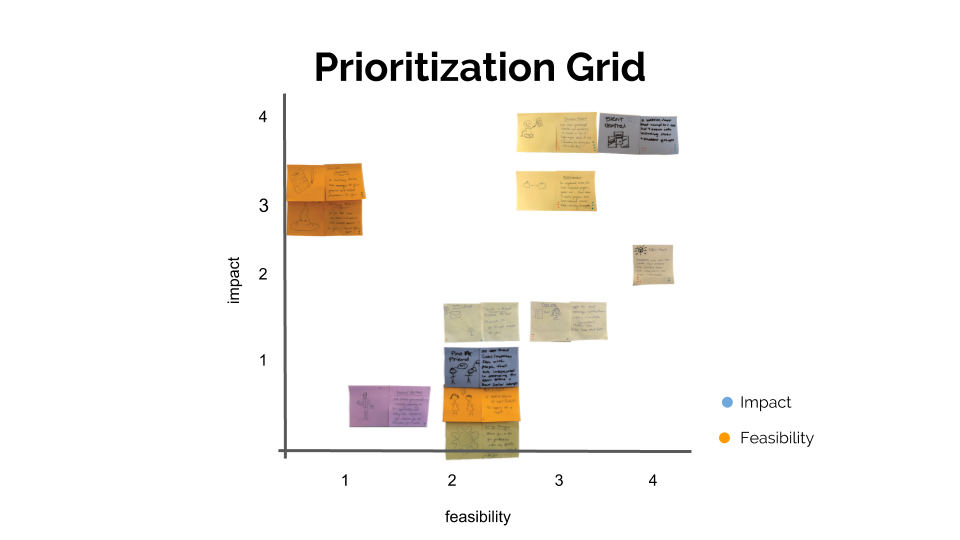
We voted our ideas based on feasibility and impact, and mapped it on a prioritization grid to see which ideas scored the highest.
Low-fidelity Mockups
To keep our scope focused, we took our top ideas and narrowed it down to 3 feature-based goals for our design:
1
Browsing through all UofT events in one consolidated platform
2
Customizing search to find relevant events specific to users’ interests
3
Choosing to be paired up with another UofT student to attend the event together
Lean Evaluation Testing
To quickly evaluate our initial designs, I conducted lean evaluation tests with 2 representative users. I asked them to 'think-aloud' on what they thought about the features and layout of the design, specifically to understand users' mental models.
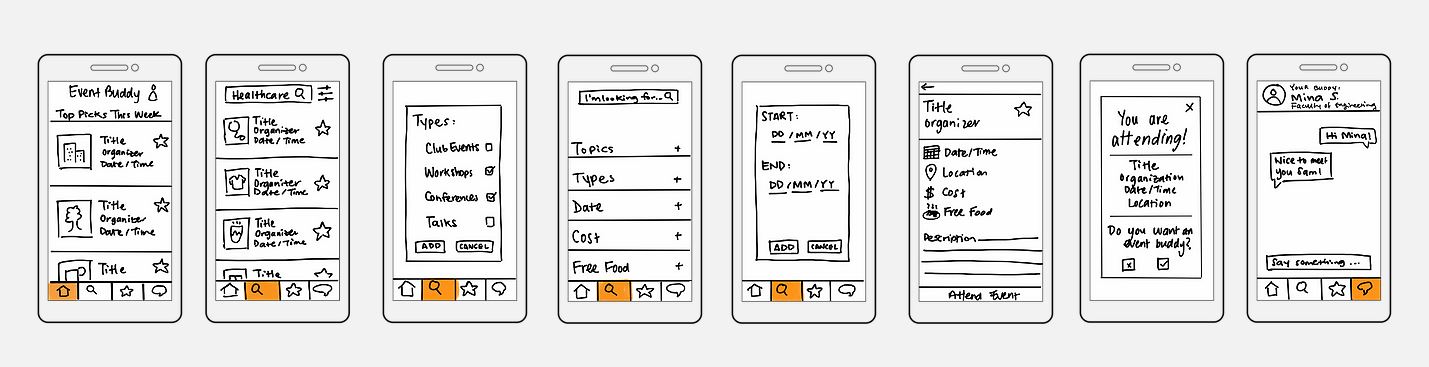
Medium Fidelity Prototypes
We used the feedback from our lean evaluation testing to improve the designs for our medium fidelity mockups. We created the designs on Figma and developed a clickable prototype using InVision. Click here for our clickable prototype.
Task: Searching for event, confirming attendance and pairing up with an event buddy
.jpg)
We designed 3 tasks based on 3 feature-based goals established earlier, and conducted tests with 3 representative users. We also conducted post-test interviews to learn more about what they thought and experienced with the design.
After the tests, we compiled the feedback and drew key points to inform our next steps, as organized below.
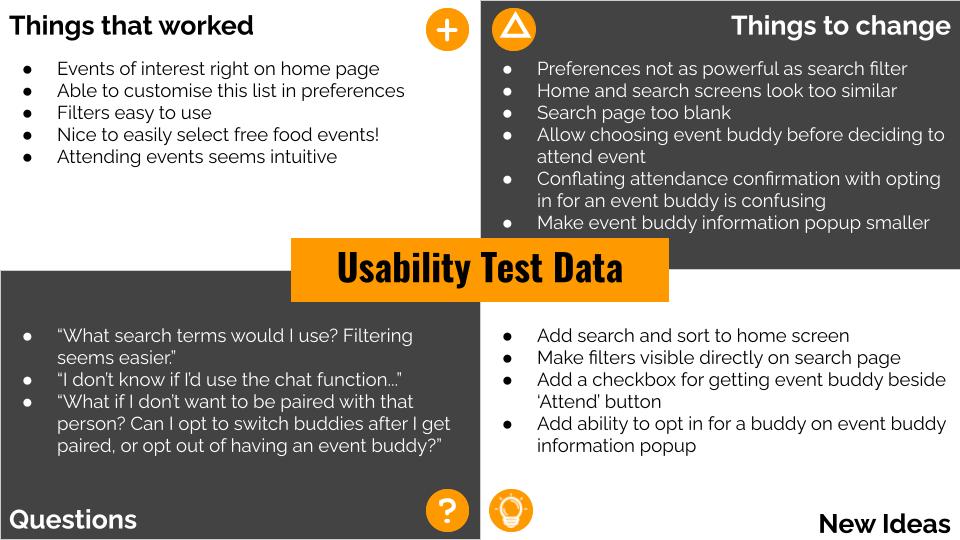
Based on our results, we determined we would have to make some design changes and additions on our home screen, search screen and confirmation screen. Click here for more details.
Since this is a course project, we realize our design has real-life limitations. We would need to conduct stakeholder interviews, e.g. developers, UofT event organizers, to better understand the feasibility of the app, particularly its technical feasibility. We would also need to increase and diversify the sample size of our participants to get a comprehensive understanding of our representative users.